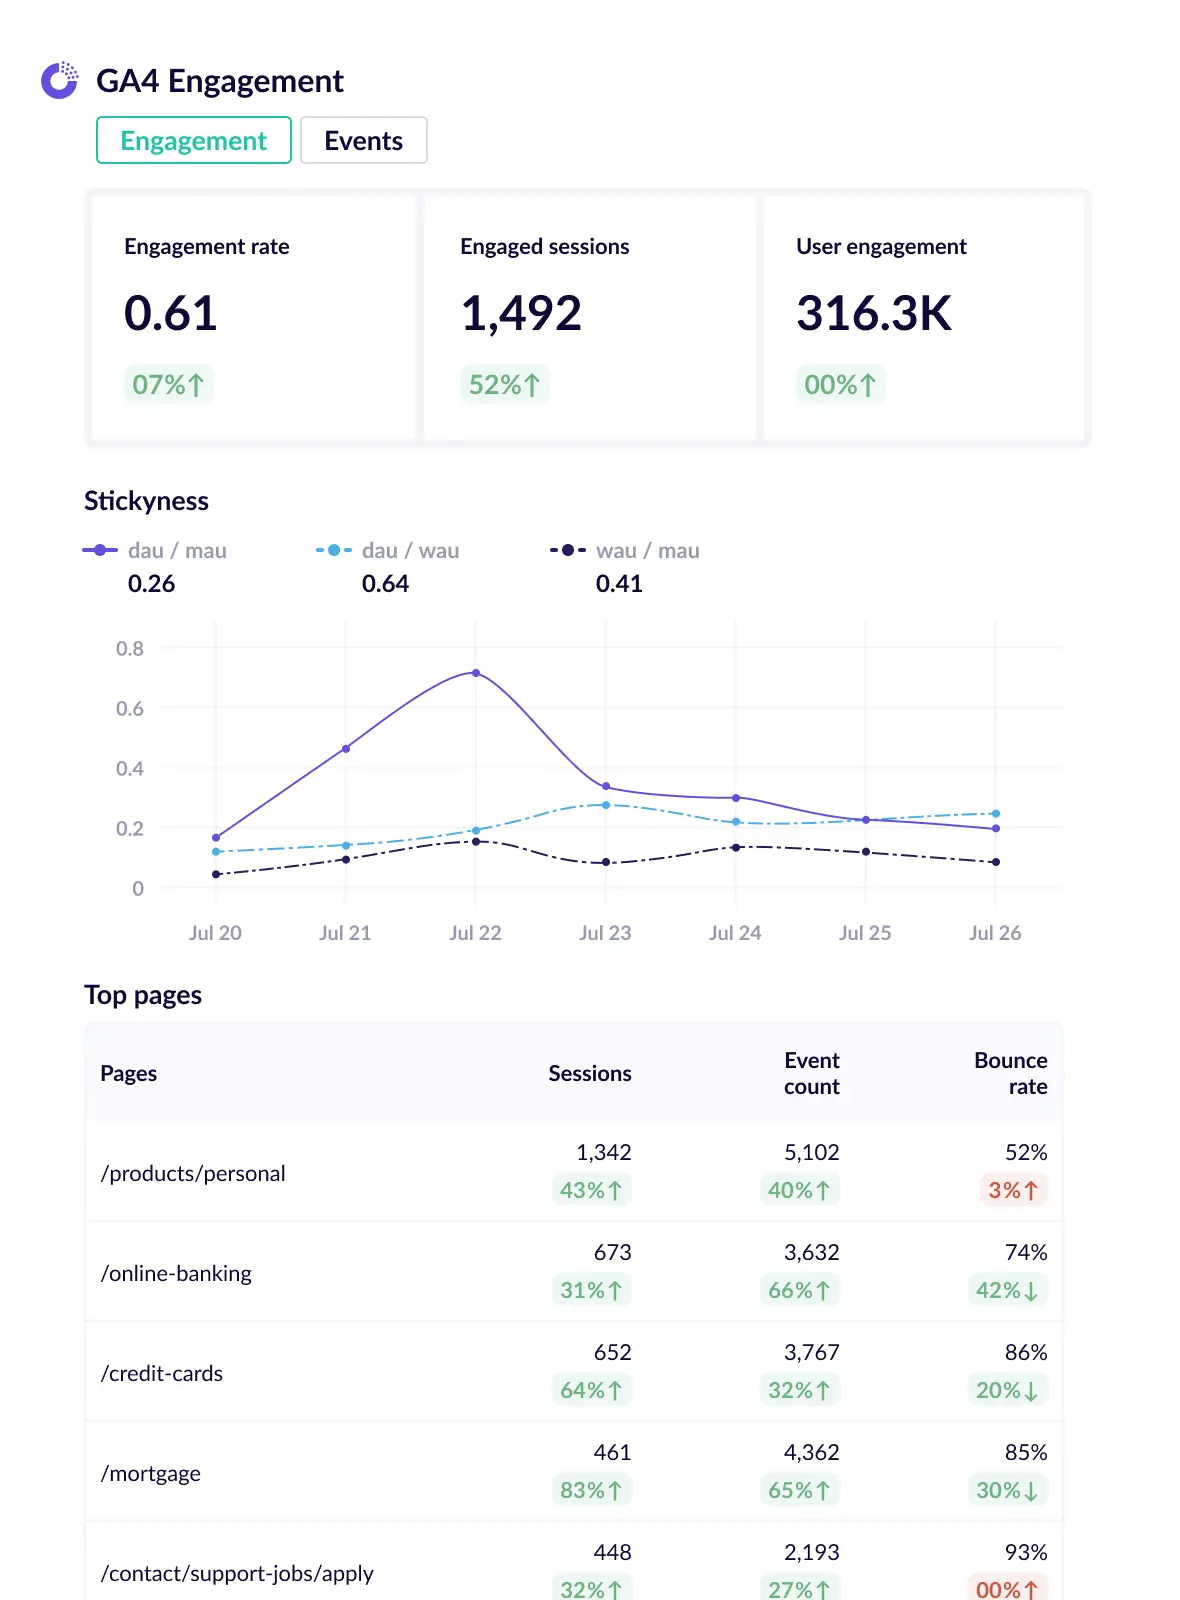
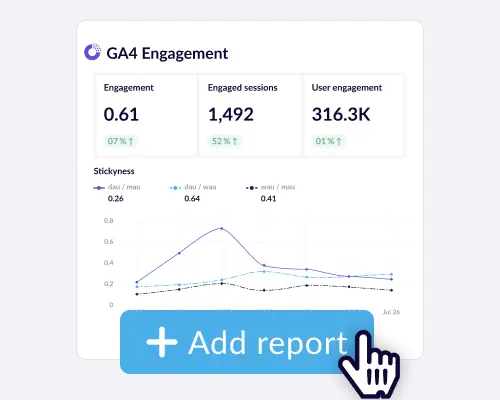
The key metrics at the top of your engagement report will give you a quick view of user engagement and how it changed over time. The engagement indicators show the percentage of people who found your site relevant and interesting enough to interact with your content, and you can also see how many sessions overall users did not bounce, they stayed to interact.
Understand behaviour patterns by seeing how your platform is retaining users and keeping them engaged over time. The line chart of DAU, WAU and MAU measures the number of unique users engaging with your site over a daily, weekly and monthly time period offering you a comprehensive overview of sustained usage.
See which pages have the most sessions and events. Seeing this can help you determine the performance of differing pieces of content and campaigns. Seeing bounce rate can help you see which pages have a high bounce rate and may need optimising to improve engagement. You can customise this table in your engagement report to show only the specific pages that matter to you.
On the second tab of your engagement report you can see a table of top events. This is useful to track trends over time of how event engagement is changing. You can also filter the table to show only your custom events, for example ‘sign-up’, ‘add to basket’ events etc.
Connect all your marketing data together to see the bigger picture in user engagement across multiple platforms at every customer stage.
Automated reportingEngagement Key Performance Indicators (KPIs) are crucial metrics for assessing how users interact with your website. The KPIs that matter will depend on your type of business, here are some important engagement KPIs:
This Engagement report focuses on Content Engagement, but you can go one step further and customise it with any additional engagement metrics that matter to your business. You can also track KPIs with the Go-Insights KPI tracking tool, simply choose any metric and set a goal, then get weekly or monthly updates of your progress.
Monitoring engagement involves tracking various metrics and analyzing user interactions with your service. You can monitor engagement effectively by:
In Google Analytics 4 (GA4), focusing on key engagement metrics is crucial for understanding user interactions You can set and track your own custom events, leverage pre-defined engagement events like scroll and pageview, and monitor user engagement metrics such as engagement rate, which indicates the percentage of sessions with multiple interactions. This engagement report will keep you informed of many of these engagement metrics.
A good level of engagement in Google Analytics 4 (GA4) is characterized by a combination of high average session duration, a low bounce rate, and meaningful interactions with content. These can be measured with engagement rate, user retention rate, and scroll-depth and combined they reflect a positive and immersive user experience.
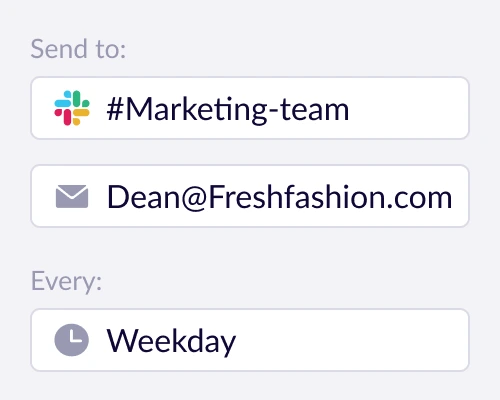
Google Analytics does not have a native integration with Slack, but you can install the Go-Insights Slack App and then easily automate receiving your GA4 reports in Slack.
For digital agencies who have multiple Google Analytics accounts to manage on their clients behalf, automated reports can save both time and help agencies stay more connected with the activity on their clients websites and campaigns. Go-Insights supports client reporting with several features suited for agencies including being able to bulk create reports, read more about automated client reporting.
Automate sending the data that matters to you & your stakeholders.
Automated reportingStay informed and ahead with automated actionable insights.
Actionable insights24/7 anomaly monitoring alerts you of unusual analytics.
Site monitoringSee how your KPIs are progressing and whether you’ll hit your targets.
KPI tracking